
1) Install the "fchart" plugin ( https://www.cs.hmc.edu/~geoff/gkrellm-fchart.html )
If your Linux distribution doesn't have a package then compiling and installing it is very simple.
I created on the fly a package for my Gentoo distro.
2) The plugin needs to be able to read a file containing the data to be plotted in the custom Gkrellm charts
The simplest format is as follows:
50
NORMAL
!!EOF!!- "50" is the value to be plotted into the chart.
- "NORMAL" is the severity level.
- "!!EOF!!" is a marker to make "fchart" know that it can stop reading the file.
Extra stuff like labels that have to be written inside the chart can be added.
To plot more then one value (to show multiple lines inside a single chart) then just add the additional values for example like this:
0 52
NORMAL
!!EOF!!
In the above example the "0" refers to the RPMs and the "52" to the degrees celsius of my GPU's card.
2a) Generate the data
Do first a test by using files written by hand.
In my case once I confirmed that the "fchart" plugin was working when using the file written by hand I then wrote a Python program that would gather my nVidia GPU's Fan RPMs & temperature and processor usage percentage and VRAM usage percentage metrics:
#!/usr/bin/python

import time, os
from pwd import getpwnam

#Docs: https://pypi.org/project/nvidia-ml-py/
#  https://docs.nvidia.com/deploy/nvml-api/group__nvmlDeviceQueries.html
#  Gentoo package: dev-python/nvidia-ml-py
from pynvml import *

#======================

#bGLBL_DEBUG = True
bGLBL_DEBUG = False

#======================

def msg(sMessage):
	if bGLBL_DEBUG:
		sDateTime = time.strftime("%G-%m-%d %H:%M:%S")
		sResult = sDateTime + " " + sMessage
		print(sResult)

def qs(s):
   return "\"" + s + "\""

def write_in_place_fchart(sPathFinalfile, var1, var2):
	with open(sPathFinalfile, "w") as handleFile:
		handleFile.write(f"{var1} {var2}\nNORMAL\n!!EOF!!\n")

#======================


if __name__ == '__main__':
	uRefreshIntervalSecs = 1
	sTargetUsernameToReadResults = "REPLACE_ME_WITH_GKRELLM_USER"
	uSleepSeconds = 1

	#======================

	msg("Trying to get UID of user " + qs(sTargetUsernameToReadResults) )
	uTargetUserid = getpwnam(sTargetUsernameToReadResults).pw_uid
	if not isinstance(uTargetUserid, int):
		msg("ERROR while retrieving UID of user " + qs(sTargetUsernameToReadResults) + " - I expected to get back an integer but got back a " + str(type(uTargetUserid)) )

	sTrgtDir = "/run/user/" + str(uTargetUserid) + "/"
	msg("Files will be written to the directory " + qs(sTrgtDir))

	msg("Initializing pynvml module.")
	nvmlInit()
	handleGPU = nvmlDeviceGetHandleByIndex(0)

	uVramAvailable = nvmlDeviceGetMemoryInfo(handleGPU).total
	msg("Total available VRAM: " + str(uVramAvailable))

	dictTrgtFiles = {
		"grp1":{"sWorkfile":sTrgtDir + "fchart-grp1-work.txt", "sFinalfile": sTrgtDir + "fchart-grp1-final.txt"},
		"grp2":{"sWorkfile":sTrgtDir + "fchart-grp2-work.txt", "sFinalfile": sTrgtDir + "fchart-grp2-final.txt"},
	}

	try:
		while True:
			#Do nothing until the directory is created
			if not os.path.isdir("/run/user/1000"):
				continue

			msg(" ")
			utilizationRates = nvmlDeviceGetUtilizationRates(handleGPU)

			#Get processor utilization
			uProcessorUsagePct = utilizationRates.gpu
			msg("GPU processor usage: " + str(uProcessorUsagePct) + "%")

			#Get memory utilization
			uVramUsed = nvmlDeviceGetMemoryInfo(handleGPU).used
			uMemoryUsagePct = int(uVramUsed / uVramAvailable * 100.0)
			msg("GPU memory usage: " + str(uMemoryUsagePct) + "%")

			#Get temperature
			uGpuTemperatureCelsius = nvmlDeviceGetTemperature(handleGPU, NVML_TEMPERATURE_GPU)
			msg("GPU temperature: " + str(uGpuTemperatureCelsius) + "°")

			#Get fan activity
			uFanPct = nvmlDeviceGetFanSpeed(handleGPU)
			msg("FAN usage: " + str(uFanPct) + "%")


			write_in_place_fchart(dictTrgtFiles["grp1"]["sFinalfile"], uMemoryUsagePct, uProcessorUsagePct)
			write_in_place_fchart(dictTrgtFiles["grp2"]["sFinalfile"], uFanPct, uGpuTemperatureCelsius)

			time.sleep(uSleepSeconds)

	finally:
		msg("About to shut down pynvml.")
		nvmlShutdown()
I initially wanted to first write everything in the file "sWorkfile" and then later do an atomic "os.replace()" to "sFinalfile" but for some reason that did not seem to work: fchart then stopped noticing updates done to those files.
Maybe that's caused by fchart opening an inode and then keeping track only of that particular thing therefore not noticing that I replaced that inode/file with another one.
Anyway that's now the script that runs in my Gentoo distro as a daemon and keeps updating the contents of the temporary files "/run/user/1234/fchart*.txt".
The above script writes e.g. into the file "fchart-grp2-final.txt" the Fan RPM (0 in this example) and the temperature celsius (52) of my nVidia GPU like this:
0 52
NORMAL
!!EOF!!
2b) Tell the fchart plugin to read the contents of the files being generated
Activate the fchart plugin in Gkrellm, then create a configuration by using for example these settings:
- Label: "GPU metrics #2"
- File to Chart: "/run/user/1234/fchart-grp2-final.txt"
-
Charting Interval: 15
(maybe you should use here the same interval that you set in Gkrellm's config under "General -> krell and LED updates per second") -
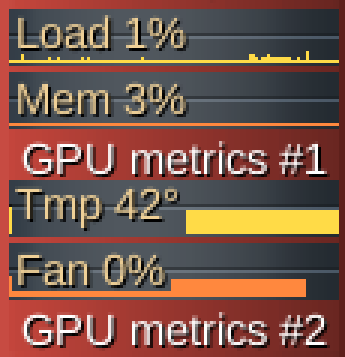
Label Format: "Tmp $Bº\bFan $A%"
That format should then display the read values with the following labels:
Tmp 52º
Fan 0%
The meaning of the "label format" that I used in this example is:
- "Tmp ": a string prefix
- "$B": the second value contained in the file ("52" in the above example)
- "º": a string/character suffix (the degrees unicode character that will follow the shown number)
- "\b": go to the bottom of the chart
- "Fan ": one more string prefix
- "$A": the first value contained in the file ("0" in the above example)
- "%": another string/character suffix
Some of the available formats are:
- "$A", "$B": the IDs of the variables written in the file (not sure if more than 2 variable can be used)
- "$M": the current maximum Y-axis value of the chart (useful if the "Auto" option is selected in "Resolution per Grid" of the chart options)
- "\c": text has to be centered
- "\l": text has to be left-aligned
- "\r": text has to be right-aligned
- "\t": text has to be at the top
- "\b": text has to be at the bottom
- "\f": use alternate font (set in gkrellm's general config)
3) Format the chart
Use the normal Gkrellm functionality by right-clicking on the Gkrellm chart area.
In my case I wanted two graphs/charts to be displayed in a chart area, but I still split the chart into two parts:
-
"File data 0":
- deselected "Line style" to have a full area plotted instead of just a line.
-
"File data 1":
- deselected "Line style" to have a full area plotted instead of just a line.
- selected "Split view" (set to 0.50) to have 2 separate charts plotted instead of having them merged.
- "Resolution per Grid": deselected "Auto" (as the charts are too small to have "$M" painting the chart scale) I set it to 50 to have the max chart height hardcoded to 100 (not sure why I had to do that - maybe because it sums up the 2 areas set to 50?)
4) Result
Seems to work and looks neat to me:
Careful when editing many times in a row the "fchart" settings: sometimes fchart/gkrellm started missing plotted pieces and other weird things happened -> to avoid chasing ghosts, if you run into mysterious problems you might want to first of all try to restart Gkrellm and see if that fixes your issue.